Interactive Lissajous Curves Visualization
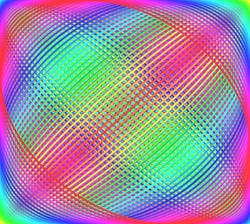
Lissajous Curves are simple curves made from two sin waves, one for the X axis, one for the Y. If we trace a (X,Y) point over time, we have an animated curve drawing. Sprinkle in some colors and controls to change the parameters and we can generate a variety of cool effects.
Animated interactive visualization
In the frame below, there is a parametric animation of Lissajous Curves, with random parameters that change every few seconds. There is also a "⚙️" menu that let's you change them to achieve a variety of different effects.
Parameters controlling the shape.
- Frequency X or Y Controls how fast the point oscillates Horizontally or Vertically. The important thing is the relation between X and Y. For example if Frequency X is 2x bigger than Y, there will be 2x more loops drawn on the Y axis.
- Amplitude X or Y This is just a percentage of the covered axis. At 100% it will cover the whole visualization canvas, while at 50% it will cover the half of the canvas in the center.
- Damping "Friction" that decreases the amplitude, allowing for creating spirals.
Parameters controlling the appearance.
- Line width simply controls the width of the stroke. Increase it to make the line thicker.
- Opacity controls the opacity of the drawn line, allowing for a different look and mixing colors with previous strokes.
- Color cycle Changes how fast is the change in color of the stroke. This allows for drawing a single color or a full rainbow.
How to edit values of parameters?
Press the ⚙️ button on the visualization. Turn off the Auto Randomize (because it will override your changes). Use the sliders to change the parameters. For more precision, you can edit the numbers directly, by clicking on them and typing desired value.
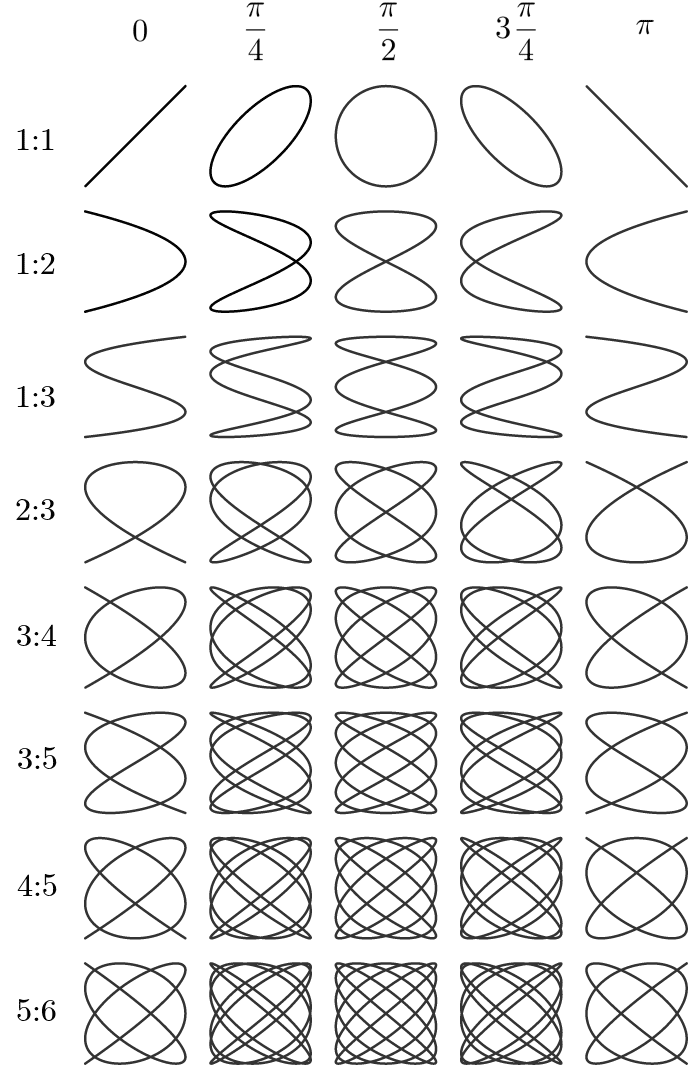
What types of curves we can get?
I snatched this beautiful table from Wikipedia. It shows the types of patterns we can expect. These ones don't use friction or damping, so they form stable curves, that repeat forever.
Ideas for expanding the parameters.
There is several methods to get Lissajous Curves. I used a couple of Math.sin function calls in javascript. Here are some other examples:
Drawing Lissajous curves with a pendulum.
You could use a bucket of paint or sand with a hole on string, and use it as a pendulum. The leaking paint or sand would create a very good approximation of the Lissajous Curve.
I wish I could add more options to the visualizer, like multiple "holes" and a "spinning bucket", to generate even more types of patterns. One could make paint simulation with color mixing, and dripping effects, and different arrangements and colors of paint and holes in the bucket. We could also have different shader effects for different looks, like iridescent fluid.
Another idea I got is to connect Lissajous Curve Generator to different types of simulations. Imagine having 3 buckets of different types and colors of bacteria, or fungus, or fuel. Then a game of life takes over and evolves the patterns. Or a fire simulation consumes the stream of fuel while another one extinguishes it, in a never ending cycle.
Drawing curves by using a spring.
An oscillating mass on a spring makes a nice sinusoidal wave generator. You could use different springs or masses to generate the wave with different parameters.
I wonder what types of shapes we could get from different arrangements beyond just 2 springs - one for each axis. We could make a hexagon of springs and masses or a 3D structure like a cube. Then plot the behavior of a chosen vertex. We could change the strengths of the springs with parameters and watch how the curves change. But I have a suspicion that we would get chaos.
How is this useful
These curves aren't very useful.
But they look cool. Some artists use them in their designs and some companies have incorporated them into logos. Wikipedia lists a couple of very niche practical applications, like in experimental tests to determine if a device may be properly categorized as a memristor
, whatever that means...
I would use it as a screensaver.
More visualizations
I look forward to making more interactive visualizations for this website. Perhaps a series on different mathematical curves.